Boom500 asset
Price broke the previous high on the weekly timeframe. On the daily timeframe I can see that yesterday’s candle was the one that broke the previous high on the weekly but left a long wick and came down. Today’s candle was also bullish but it’s currently liquidating and leaving a wick. On the H4 timeframe the price created 2 highs; one higher high and another lower high which is the result of the daily candle liquidating currently.
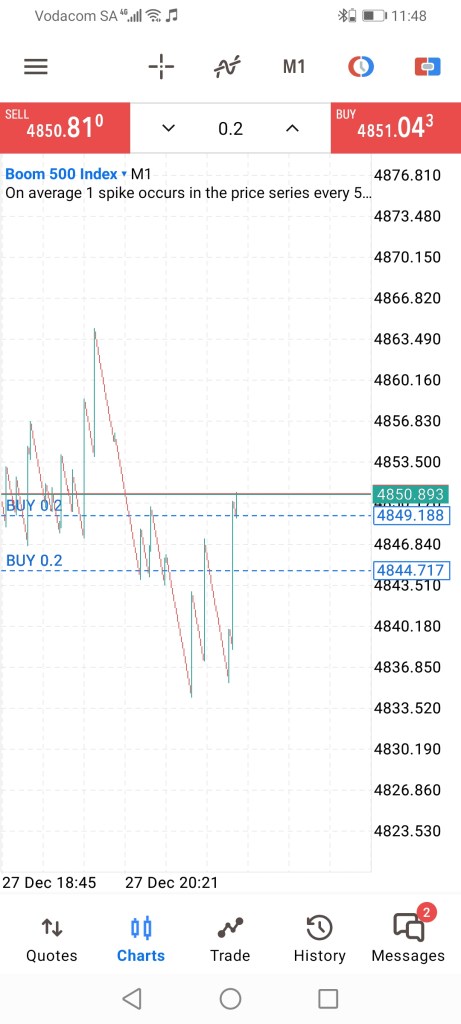
Price took out a buy signal after a bullish FVG and a bearish FVG were mitigated. Because of this buy signal that I got, I’m treating the area that price is currently trading at as a bullish OB. This means that I’m anticipating that the price might go higher.
A valid sell signal just came out after I recieved a valid buy signal that did not take out a spike. I’m holding this buy directional bias.
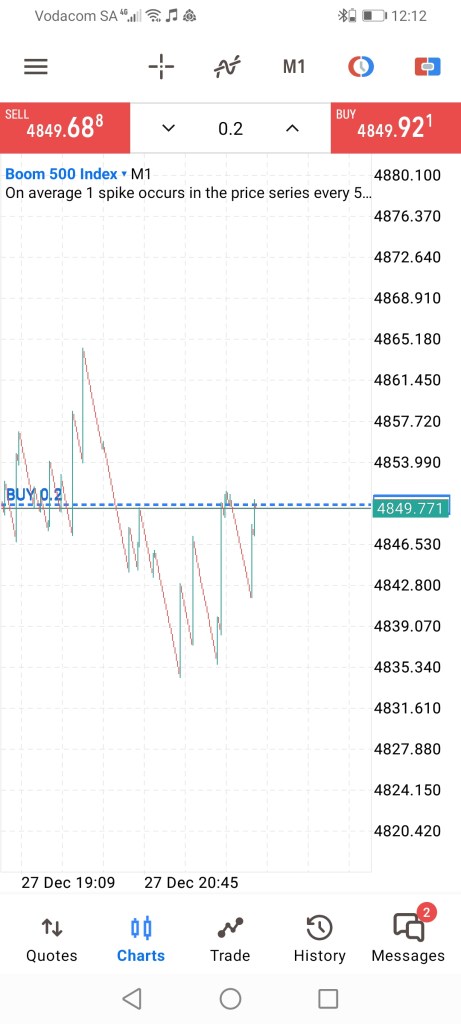
Let’s see if price will break the lower high that it created. If price breaks the lower high, I’m exiting my trades, if it doesn’t then a spike will come out.
Well, a small spike just came out. It wasn’t big enough to give out another buy signal. I would be closing but I really want to see if the price would break the higher low that it created…. Aaaand the price took out a big spike. As a result, price took out another buy signal. I’m entering with more buys…. Aaaand another spike came out.
Price shows a bullish Order Block on the M30 timeframe but shows a bullish FVG in the M15 timeframe.
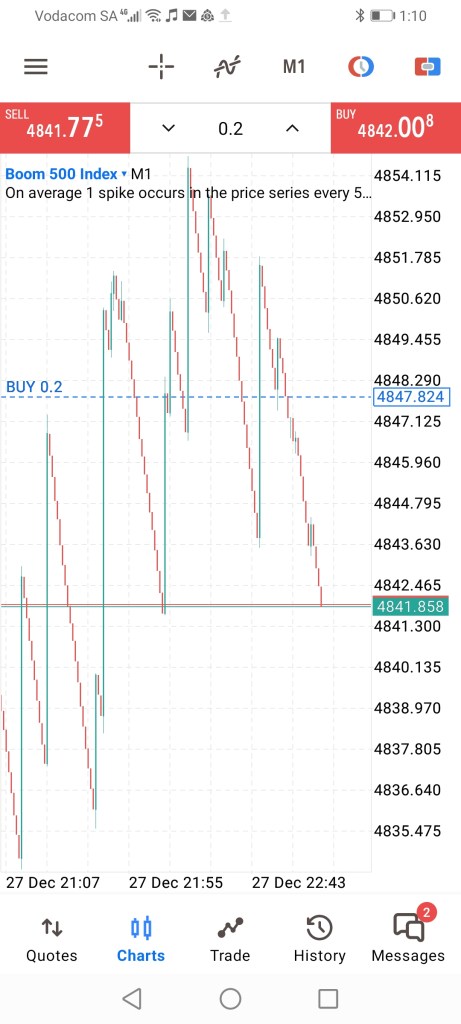
Just received another buy signal
Price took out a small spike a couple of seconds after I entered the trade. I held the directional bias but price kept on trading lower and I decided to close.

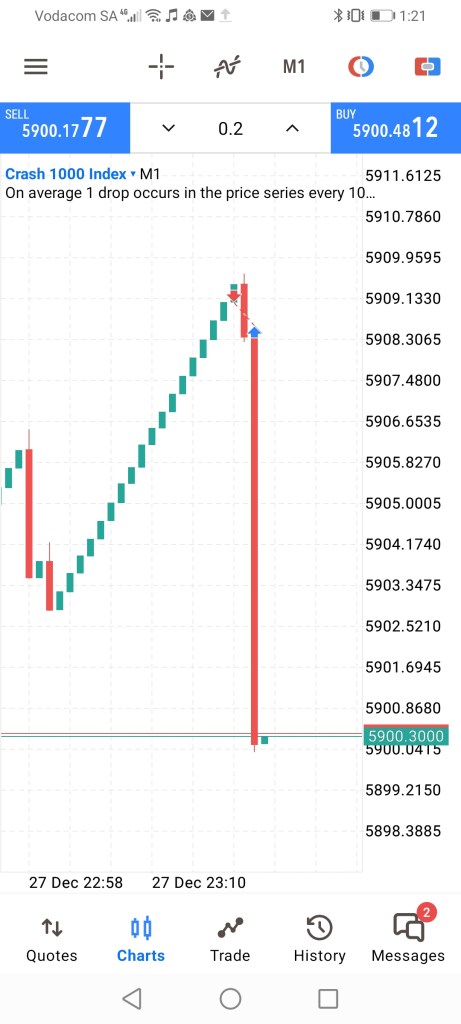
Another signal came out but this time it was from a different asset. It was from the Crash1000 asset. It gave out a valid sell signal. I placed the sell trade and it was successful. However as soon as I exited the trade, price continued to fall and as a result, it took out a very long bearish spike.