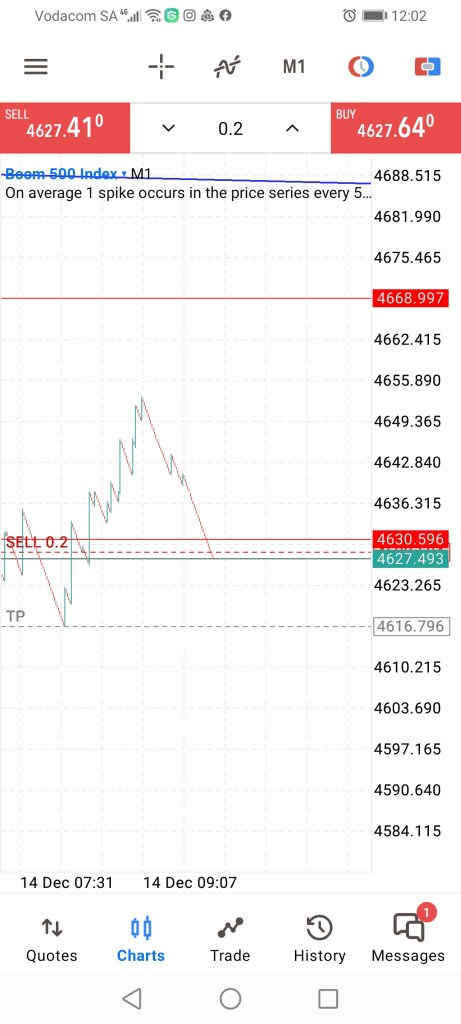
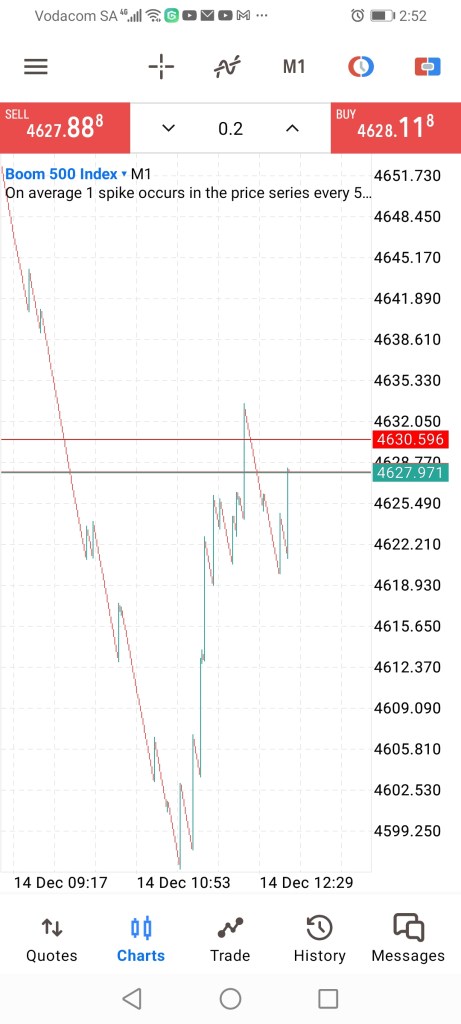
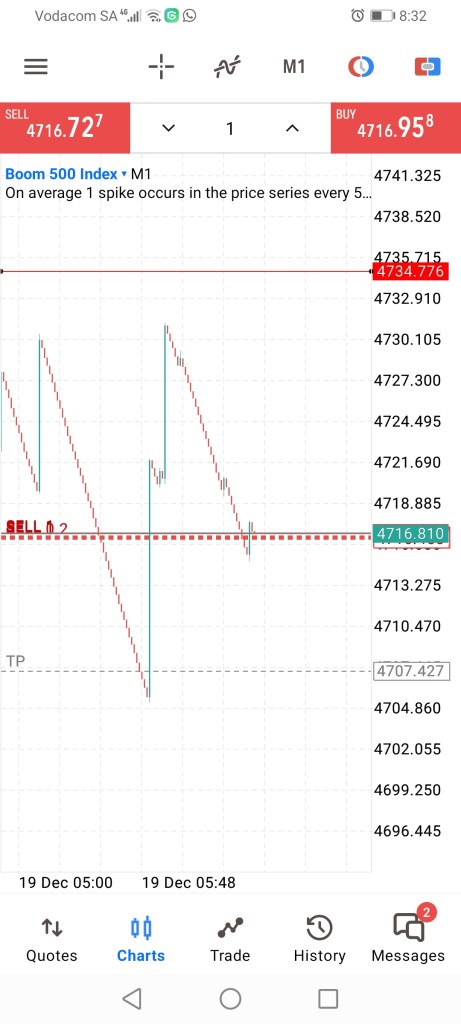
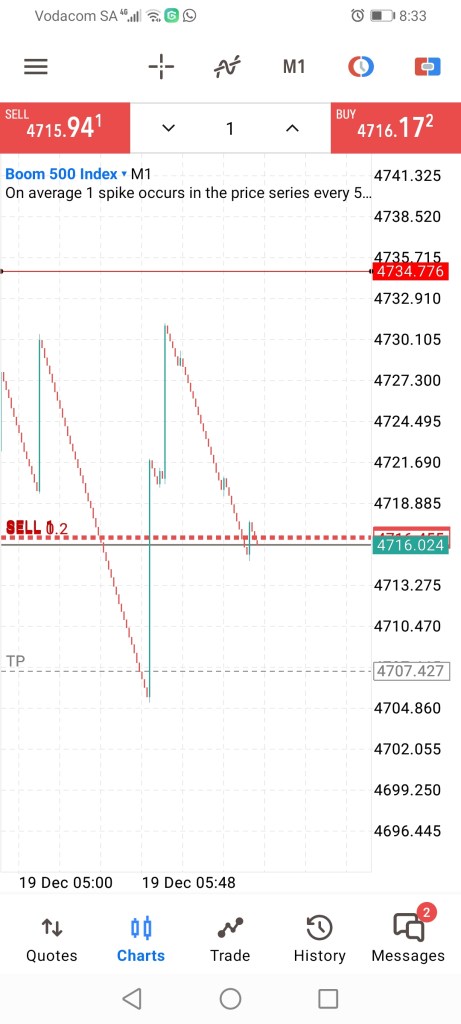
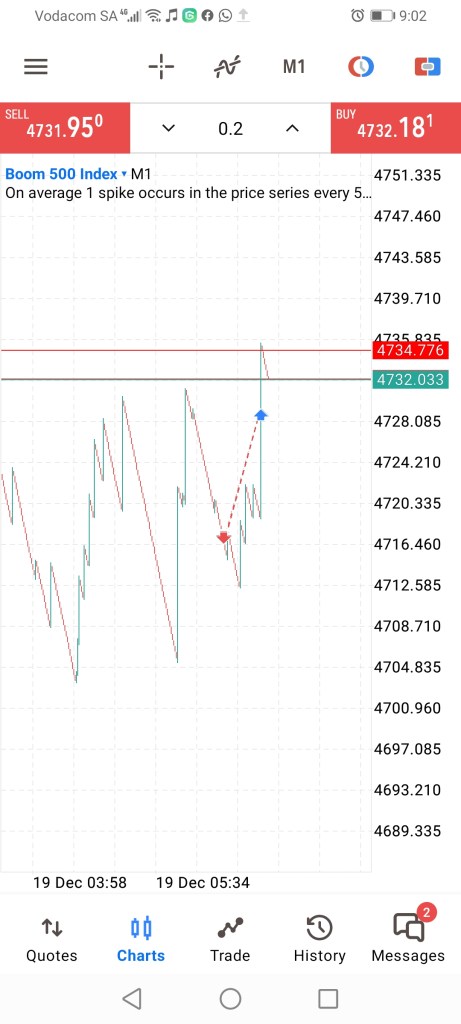
A very goodmorning. It’s 8:30 am and my template just gave out a valid sell signal with regards to Boom500. It’s going to be a clean downfall. There aren’t any previous relevant swing points other than a low found around the 4705.558 price level.
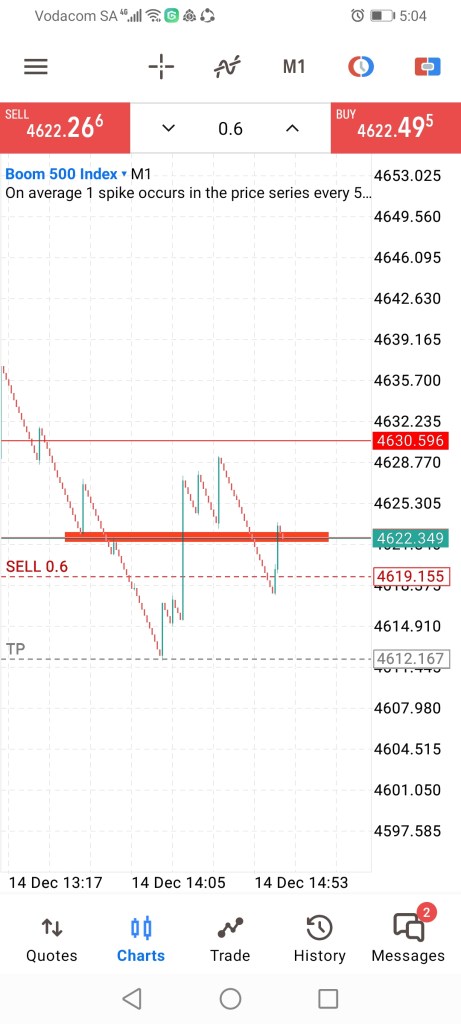
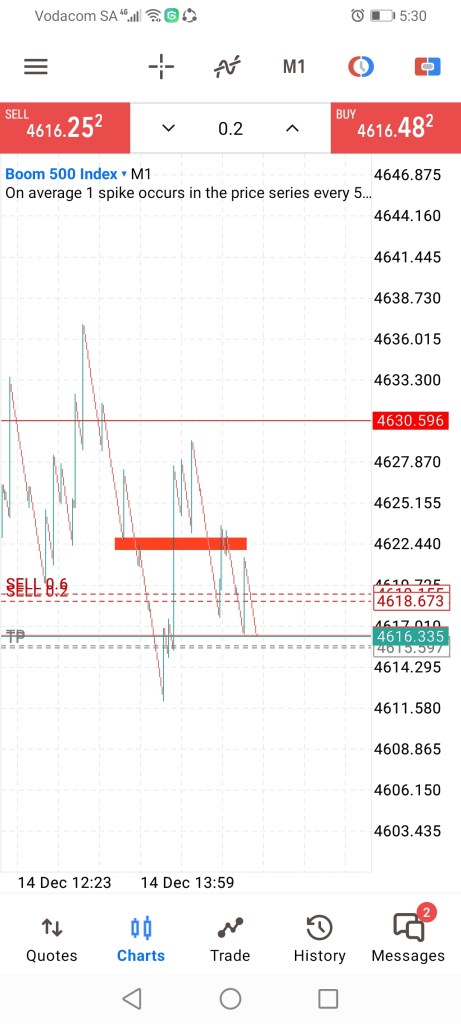
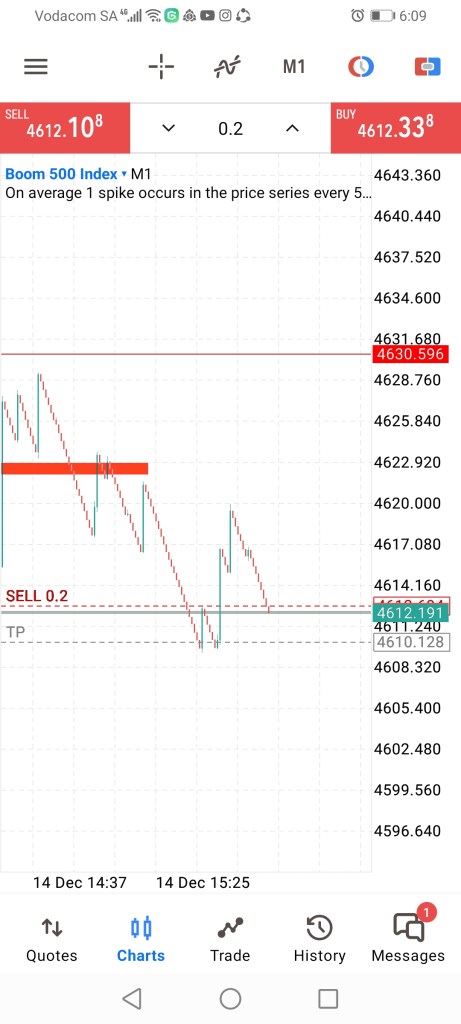
I placed sell positions and will take partial profits before the price reaches the low.
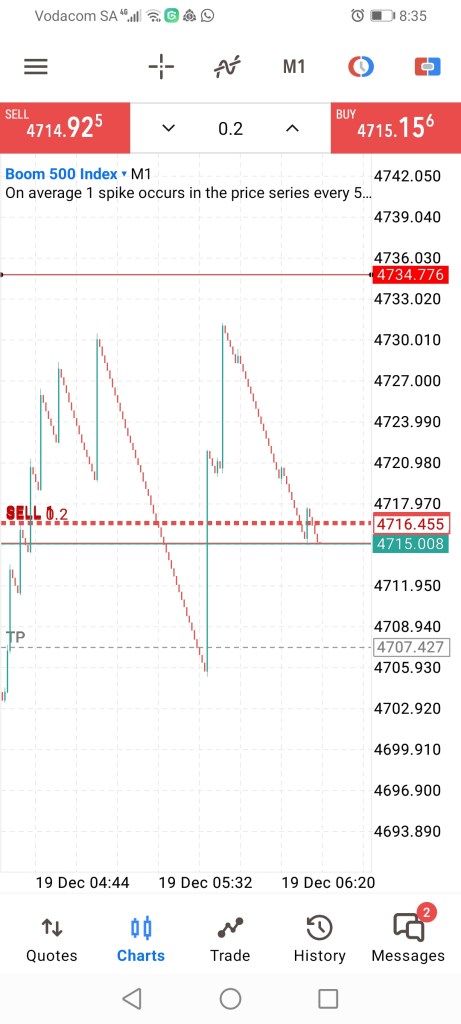
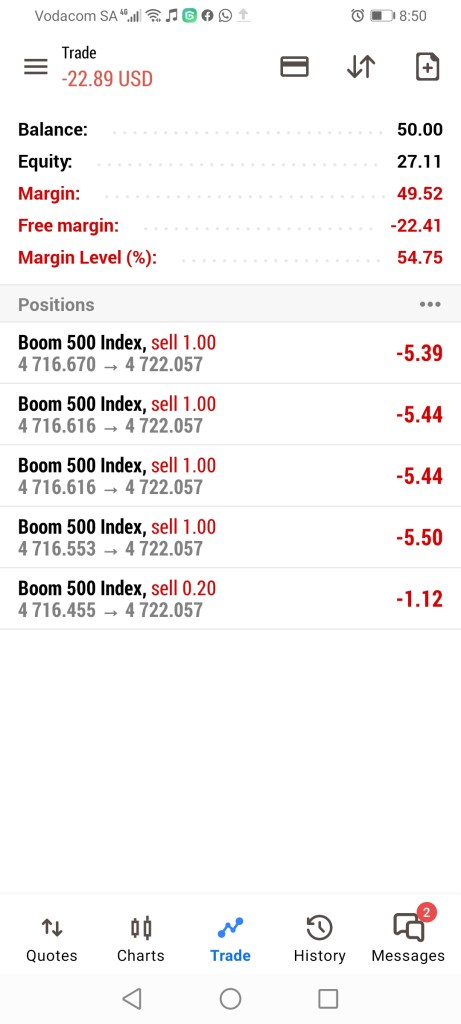
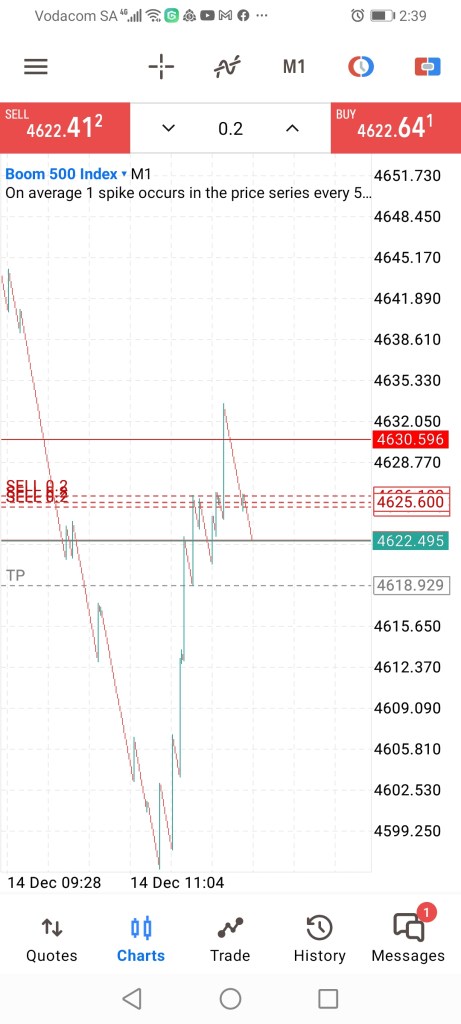
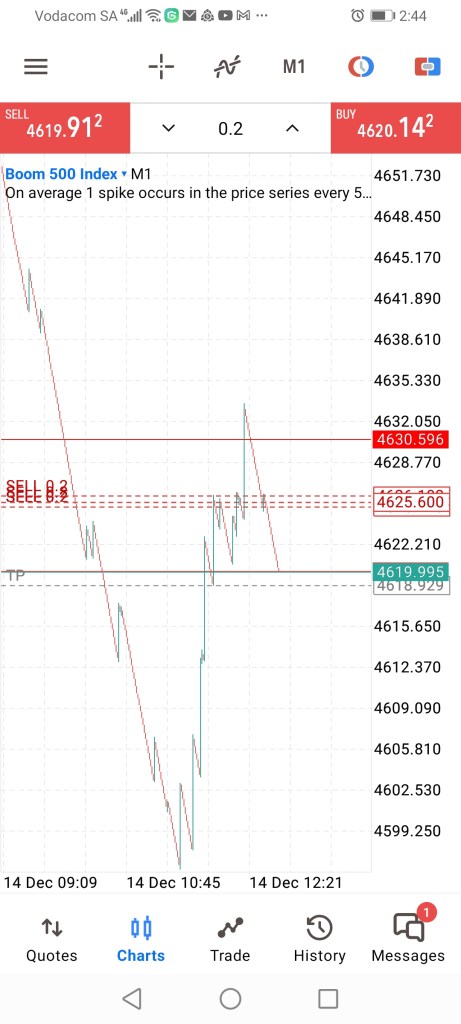
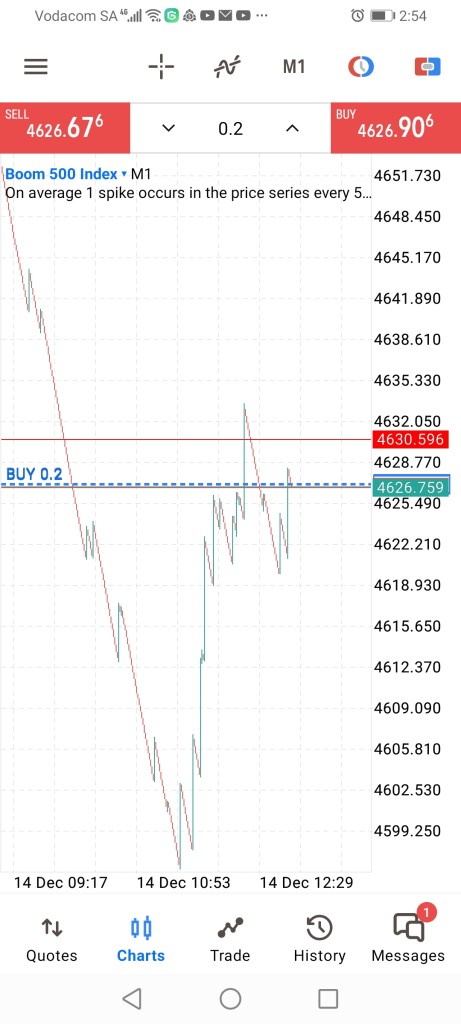
Running losses. There were no previous swing points so price might still fall down to the above mentioned level or continue going to the upside because I might have sold at an area where it’s predestined to make a turning point
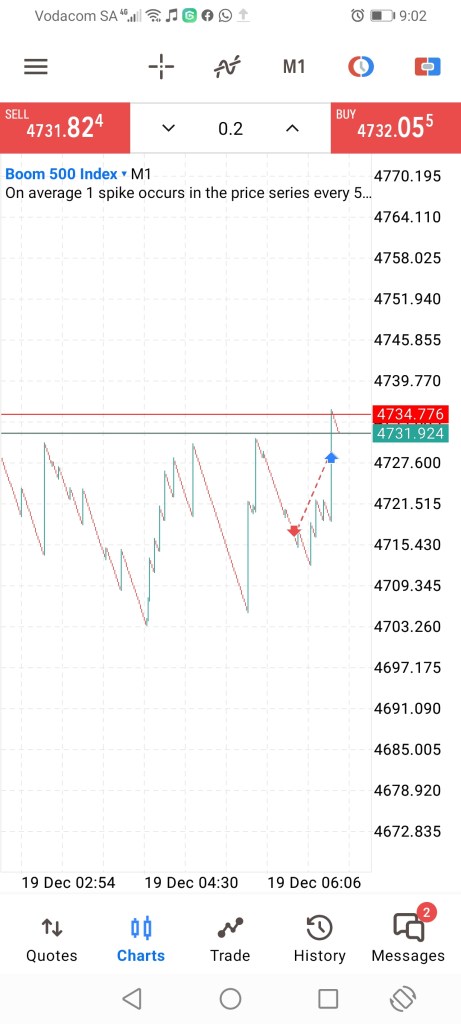
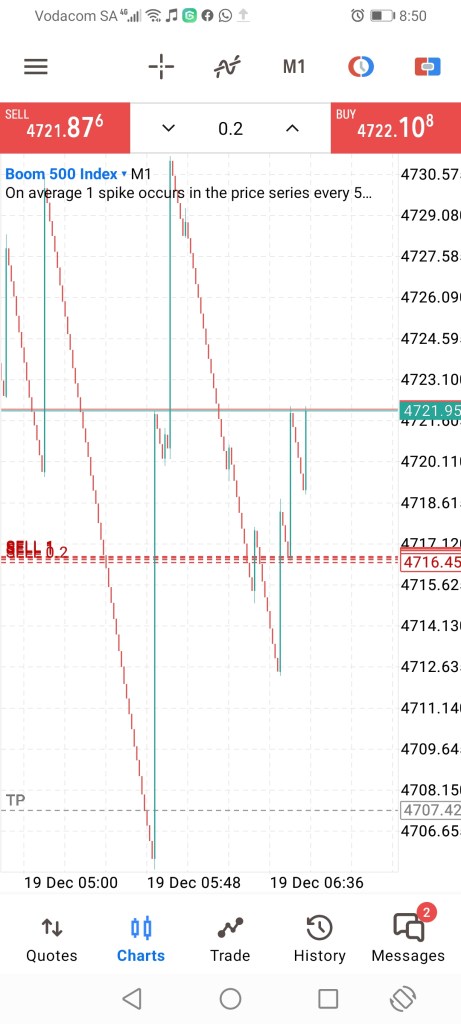
Before I recieved this sell signal, price took out a buy signal which took out a spike and satisfied that signals directional bias. A sell signal that I after the buy signal was valid because it was confirmed by my confirmation indicators. Price only went down for some time but eventually took out more spikes pushing price to the upside against my directional bias. I’m still making my investigation as to what might have caused the price to make a turning point at the 4712.328 level without satisfying the sell signal.
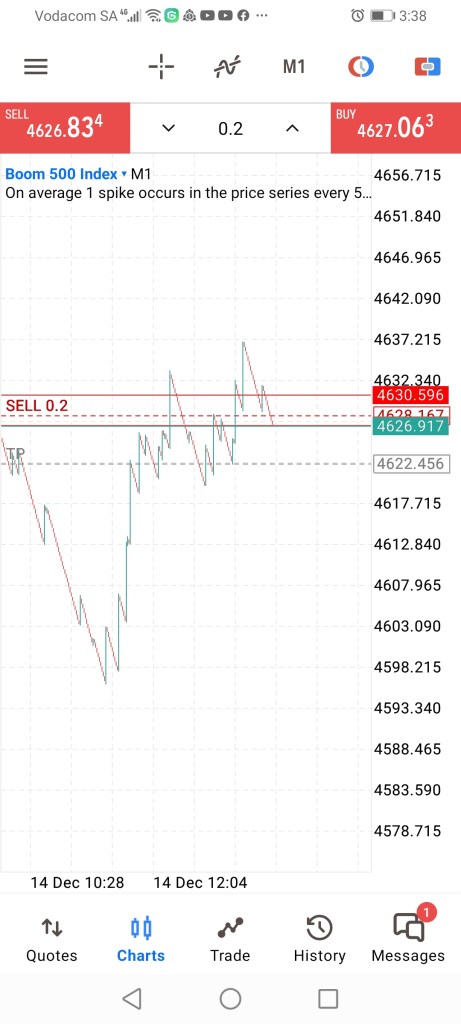
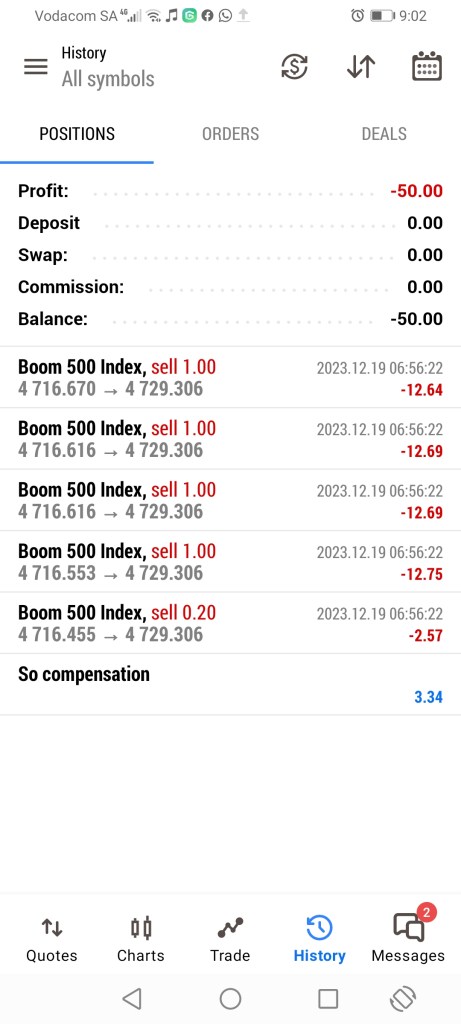
Sell was unsatisfied because of the daily FVG that I missed. It threw me off because there were a lot of bullish candles of which some of them are in a doji form of candlesticks and I didn’t know which candles to use for FVG. This means that on a bullish FVG, do not place any sell trades, we look for buy opportunities only. On a bearish FVG we do not look for buying opportunities but rather selling opportunities. Now because I failed to identify the FVG I paid $50 for failing to do so.
I just opened up the charts right now at 19:55 to check how price has been moving and to go back to the unsatisfied sell I experienced earlier today. I also realize that I missed the double top that price made along with the left shoulder. Price was actually making an inverse H&S and where the template took out a valid sell signal is where price was creating a right shoulder. The price did fall with a few candles as the signal came out but because price was trading at the swing low that created a left shoulder, price made a turning point there. This shows that before a trade is to be placed, we need to consider a lot of things. Therefore it is crucial to prepare for the trading session that you ought to have in advance and then adjust as price unfolds.
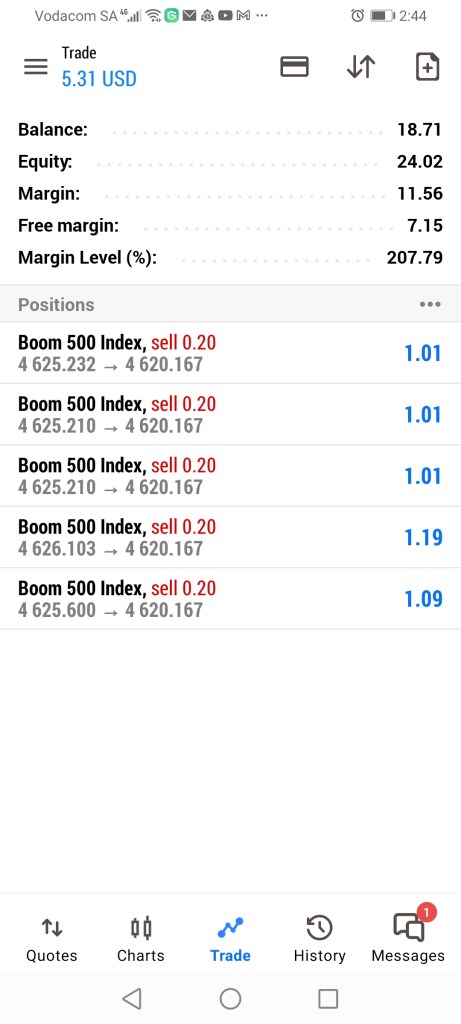
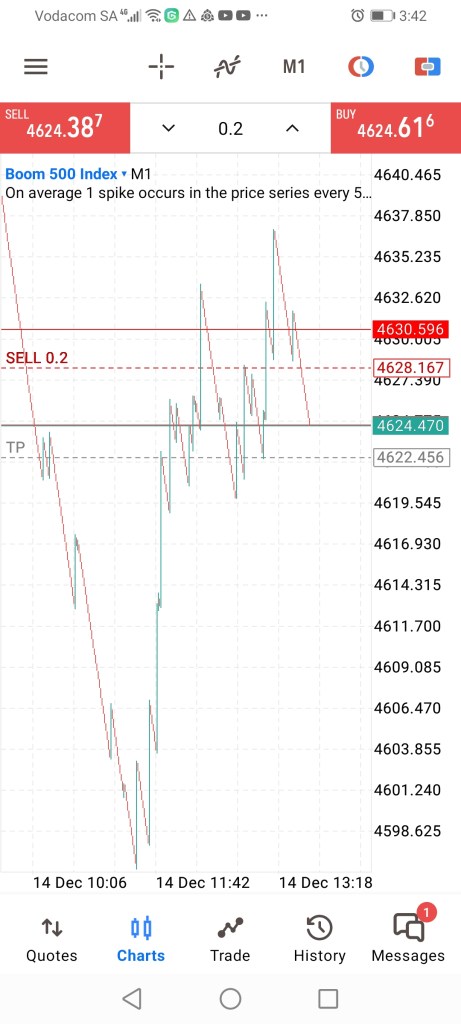
When taking buy trades, I’m going to use the smallest lot size because sometimes price paints out a lot of candles/falls for a long period of time before going to my directional bias. Therefore, with a smallest lot size, I’ll be able to hold my trades and at the same time scale in as price continues to fall. When it falls for a long duration of time it gives me an opportunity to place more trades, placing me in a position of not breaking even but accruing profits accordingly.
Basically this template that I use works hand in hand with other methodologies like technical analysis, Smc, etc. All this knowledge coexist in the market because market movement isn’t derived from one specific thing only. E.g; when price created a retest and I get a buy signal from the template, do not take that buy because price is likely to sell, therefore wait for that sell.
I just did a top down analysis to get an overall view of what price intends to do next. I see that in the daily timeframe, price created an inverse H&S pattern but now 50% of the left shoulder price made it’s turning point. I’m also expecting price to make a turning point 50% of the right shoulders strong bullish movement. Price is currently bearish therefore I would like to see it trading into the 4445.00 & 4193.00 zone. That zone is what I labeled as a buy zone that I think will serve as a continuation of the overall bullish movement inspired by the Daily, Weekly, and Monthly inverse H&S pattern. I’m placing my buy limit orders inside of this zone.